The transmission network in the National Electricity Market (NEM) is protected from overloads in times of events or during normal operation by nominating thermal ratings on primary elements (such as transmission lines and transformers), against which the real-time electricity flows should not be larger. This limitation is important in the safe operation of the power system as the chances of a transformer blowing up, or transmission lines arcing, are higher when flows are sufficiently high to heat up the conductors and make them sag.
Transmission Network Service Providers across the NEM issue the nominated safe levels of thermal ratings for each element in their jurisdiction. AEMO publishes that relevant information in the Transmission Equipment Rating which can be found here: AEMO | Transmission Equipment Ratings. In this Chart of the week, Saliw Cleto looks at how thermal ratings change from season to season for each jurisdiction in the NEM and provide a hypothesis on why they behave how they behave.
The Chart below shows the average ratio of the summer to the winter thermal rating across all lines and transformers for each region in the NEM, according to the Transmission Equipment Rating file from AEMO for ‘system-intact’ operation. It also shows the shoulder to winter thermal ratio. As transmission lines are rated differently, normalisation is needed to appropriately aggregate the figures . Winter rating is used as the base figure for each transmission element.
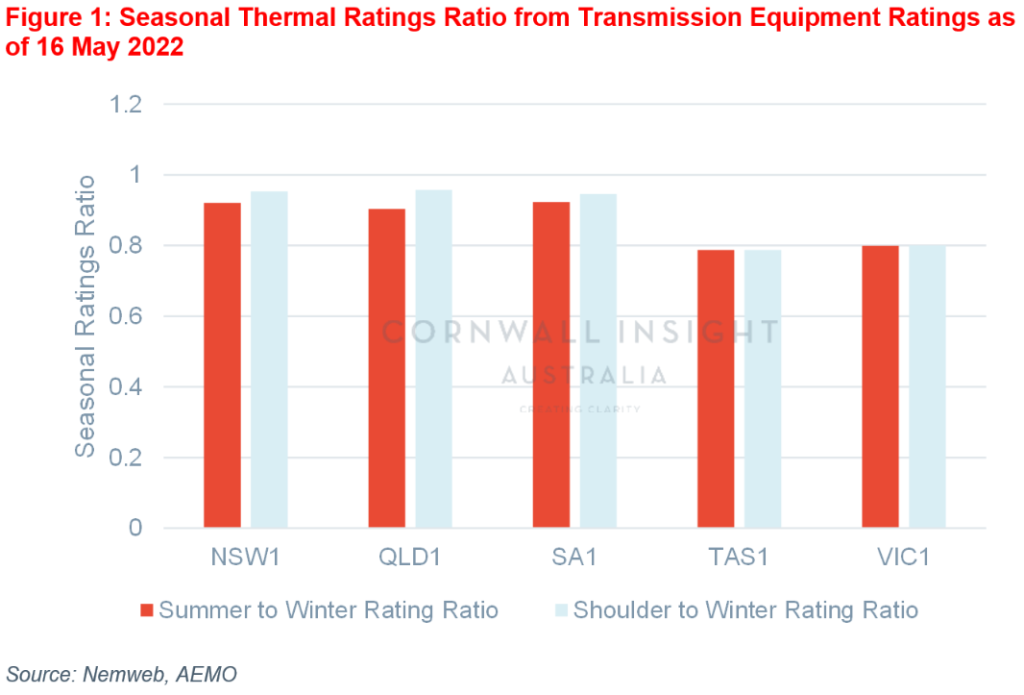
It can easily be seen from the Chart that the seasonal thermal rating ratio is lower in the southern states (Vic and Tas) compared to the other states in the NEM by a whopping 10% to 15%. This is not surprising as the biggest driver for thermal ratings is the ambient temperature, for which the Victoria and Tasmania have the biggest spread over a year. Note that, the higher the temperature, the lower the ratings, so summer thermal ratings are significantly lower than their winter thermal ratings. Unlike the northern states, where the temperature is generally warm across the year, Victorian weather is cold-ish most of the time, but when it gets warm during the summer period, the thermal rating falls down more severely. Note that in Victoria and Tasmania, ratings are defined for different ambient temperatures than for different seasons; hence, to be conservative, the shoulder ratings are taken to be similar to the summer ratings making the ratio for the summer-to-winter similar to shoulder-to-winter similar.
This temperature spread is also apparent in the way the underlying consumption behaves in Victoria, with the load factor (average demand divided by maximum demand) lower in the southern states.
This all means that, compared to other regions and through no TNSP’s fault, there is less transmission capacity in the southern states on a per unit basis due to the way the ambient temperatures behave across the NEM. While there are already many technologies being employed by TNSPs in Victoria and Tasmania to maximise the capacities of their transmission networks, such as dynamic line rating using wind monitoring systems and replacing old secondary assets that limit the thermal rating of the lines (e.g., circuit breakers, etc.), there could still be more to be done.
But more importantly, from here on, one thing that we should always consider when putting up a business case for new transmission assets is maximising the utilisation of the lines, maybe by employing new technologies or using better materials.
For more information, please contact us at enquiries@cornwall-insight.com.au.