Hydrogen is considered a potential replacement for fossil fuels for energy generation, transport etc. Currently, 96% of hydrogen production originates from fossil fuels through steam reforming and coal gasifications. Only a small fraction (~4%) is produced via electrolysis. The high Capex of the electrolyser is usually referred to as the main barrier, which will result in a high Levelised cost of hydrogen (LCOH).
In this Chart of the week, we investigate the optimal performance of an electrolyser in SA, where we consider its participation in the FCAS markets to find the impact of FCAS revenues on the cost of hydrogen production for power generation applications.
Figure 1a shows a 10MW electrolyser connected to a hydrogen tank with a capacity of 5 tons and a 10 MW fuel cell. It is assumed that both fuel cell and electrolyser use PEM technology, which has a quicker response time than alkaline technology and makes them suitable for the provision of FCAS services.
Figure 1b shows the annual cost of hydrogen broken down based on Capex, Opex, and Variable O&M (VOM) components along with the capacity factor (rhs) from 2023 to 2049. The energy and FCAS prices are obtained from our Benchmark Power Curve (BPC) and FCAS price forecast for this simulation.

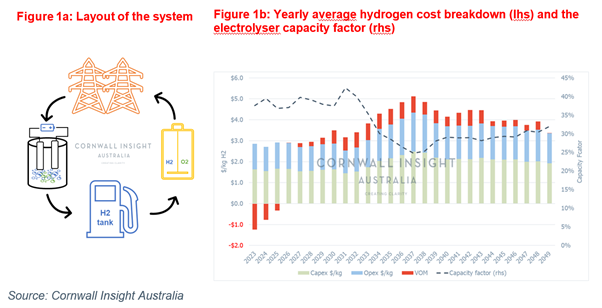
Before 2030, the contribution of VOM to total hydrogen cost is relatively low. For the first three years, it is negative, meaning that the revenues of the electrolyser are higher than its energy consumption costs. This is due to low energy prices, a large number of negative priced intervals, and relatively higher FCAS prices compared to the years after 2030. These factors incentivised the electrolyser to operate more often over those years and achieve approximately 40% capacity factor (dashed line).
The projected increase in average energy price from 2030, driven by coal retirements, drives the capacity factor lower as the marginal run cost for the electrolyser increases. Overall, the electrolyser capacity factor is 33%, which is mainly driven by the market price dynamics and low round trip efficiency (RTE) of this hydrogen plant which is:

This shows that to earn profit by producing hydrogen, the energy price at discharge time should be approximately 3 times higher than the charging price. Noting that since the Capex is not part of the optimisation model, it does not impact the system’s optimal dispatch in this analysis.
On average, the annual hydrogen production is 530 tons at the cost of $3.7/kg over the simulation period, and the Capex contributed 50% of that. Figure 1b shows that hydrogen cost reaches its max in 2037, at approximately $5/kg, which is due to high energy prices, which sequentially causes a reduction in both the capacity factor, to ~25%, and the amount of hydrogen produced. However, after 2038, the cost of hydrogen and the capacity factor are stable at around $4/kg and 30%, respectively.
The results also show that the majority of hydrogen production occurs during the day when there is a significant proportion of solar generation, which commonly reduces the energy prices. In addition, the use of the stored hydrogen by the fuel cell occurs over the evening peak, which typically has the highest prices. Both assets also actively participate in the FCAS markets and are enabled 40-60% of the time in the regulation markets.
All in all, this analysis shows that with current technologies, even if we assume the best scenario for system operation (e.g 100% availability, FCAS provision at full capacity, etc.), the optimal capacity factor of the electrolyser for generating power purposes does not exceed 45%, which is mainly driven by low round trip efficiency. This low capacity factor magnifies the impact of Capex and Opex on hydrogen cost and leads to $3.7/kg. This is 50% higher than the LCOH of conventional methods such as steam methane reforming, which has an average cost of $2.5/kg. Therefore, in addition to the need for reducing the Capex, the improvement of efficiency is crucial for increasing the capacity factor and ultimately lowering the cost of hydrogen production through electrolysis for power generation applications.
Our in-house hydrogen model and modelling consultants can help shed some light on how prices, revenues, and capacity are likely to evolve going forward. For more information, don’t hesitate to contact us at enquiries@cornwall-insight.com.au.