Gas and electricity prices in Australia are unavoidably linked, particularly in the evening peaks where the gas generators have increased capability to set the price. Due to the recent spike in global gas prices, there has been a distinct change in gas generator bidding strategy resulting in an increase in the price of offers. This, in combination with coal unit outages in QLD, led to a period of very high prices, triggering the Administered Price Cap and, ultimately, the market suspension in June 2022.
Since the market has resumed, we can see that the NEM has entered a new short to medium-term high gas price paradigm that has shifted bidding patterns in the market.
This is most evident for gas generators. Therefore, in this Chart of the week, we analyse the historical performance and bidding behaviour of gas generators post-market suspension and compared it to the same period in 2021 to illustrate how the global gas crisis has reshaped the gas generation picture in the NEM.
Gas generation is increasing across the day, but higher input costs are leading to more expensive outcomes
Gas output has increased by an average of 800MW (+37%) when compared to the same time last year. However, the increased use of gas has not been limited to the peak periods we would typically expect. There has been a 60-70% increase in average gas generation during the overnight period from 10PM to 6AM.
To show this more clearly, the chart below plots the average daily profiles for gas generation in the NEM across two distinct periods – the period post market suspension (in RED) compared to June and July last year (in BLUE). Also included are coloured areas representing the distribution between the 25th and 75th percentile observations to give an indication of the variability in output.
From the chart, we can see the uplift of average gas generation across all times of the day, with peak periods showing 1 GW of extra output on average provided by gas providers. Also clear is the separation in percentile distributions across the day, signifying an underlying increase in gas utilisation. The peak periods still show a similar level of overlap however, the overnight period shows a significant separation where the majority of observations occurred. The recent period has required gas generation to operate more consistently and at higher capacity factors, particularly overnight, to replace coal output which explains the shift.
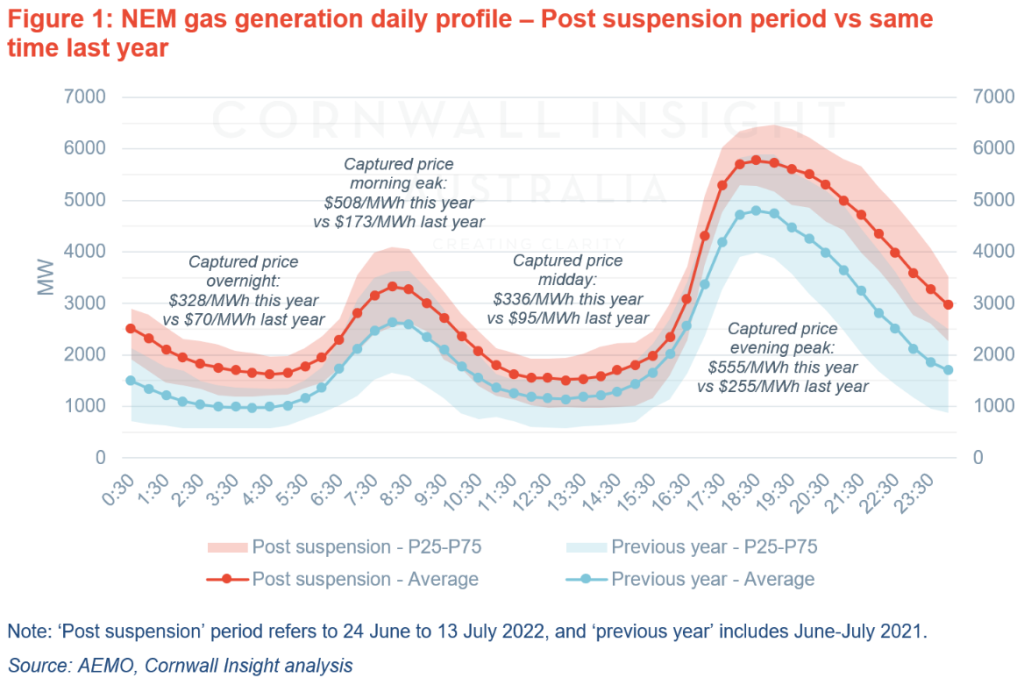
Not only is gas generation operating at higher levels than previously, but the prices at which their generation is being dispatched are factors higher than before due to elevated fuel costs. Peak periods in the post-suspension period have rewarded gas generators with captured prices of $508-555/MWh, which is around double last year’s figures of $173-255/MWh. Furthermore, there has been a significant captured price increase in the overnight and midday periods, where captured prices have increased from $70 and $90/MWh, respectively, to $328 and $336/MWh.
While gas prices remain elevated, the previous market dynamics seem to be on hold for the time being, with market outcomes indicating a change in bidding fundamentals.
Gas bidding behaviour indicates a new strategy
The comparison of the historical bid volume data post market suspension in 2022 and the same period in 2021 indicate that the available gas volume has increased by ~8%, and most gas generators shifted volumes from higher bands to lower bands.
Overall, approximately 400MW from bands 6 to 8 has been moved to bands 3-5, which resulted in 34% of the total available gas volume being allocated to the first five bands in July 2022 compared to 24% in July 2021. This change in bid stacks is more prominent in evening and morning peaks when the volumes in bands 3 to 5 displaced the volumes that used to be offered in bands 6-8.
However, this shift of bid volumes to lower bands does not mean lower bid prices for gas generation. In fact, the bid price data shows a significant change in price structures for bids in July 2022, and on average, bands 3-5, which had a price of $50 and $120/MWh, respectively, in July 2021, have almost increased by a factor of 4-5. Post suspension, the offer price for these bands starts on average at $200 and $640/MWh. The other price bands have also been changed, but the severity of those changes is not as extreme as bands 3-5.
This change in gas generators’ bidding strategy enables them to have more flexibility to capture a wider range of higher spot prices. That is, a price structure where the bands are concentrated around $300-700/MWh instead of $70-300/MWh. This allows for generators to increase their total generation volume not only during peak hours but also during off-peak periods, as indicated in Figure 1. The longevity of these changes in gas generators’ bidding strategies will completely depend on the outlook of global gas prices and how they flow through to domestic markets.
Outlook for global gas prices continues to remain elevated
The outlook for global gas markets continues to show high prices over the next 12-18 months. Looking at the ACCC netback price series shows a significant uplift in forward prices as at 29 June 2022 with the forwards showing $48-50/GJ until February 2023. This represents a $13-15 increase in price expectations over this period compared to the outlook only three weeks prior which showed price expectations around ~$35/GJ for the same period (as mentioned in our previous Cotw).
The higher price on global markets is likely to continue to influence domestic prices, which means that local gas markets would remain elevated as well. There may be some limit to exposure to global prices thanks to mechanisms that can cap the gas price at $40/GJ however, it also means that the energy sector is likely to continue to be in a period of high prices for the foreseeable future.
Looking forward
The extent to which the high prices remain is dependent on the need for gas generation (and diesel) in the supply mix. We have seen that higher renewable output can have a suppressive effect on high prices, such as the radical reduction in QLD cumulative prices over the last two days (from $1.3m to $800k). However, as we continue to see, if renewable generation from wind and solar is not present in sufficient quantities, then wholesale market prices are likely to remain very high (like in SA, which has had an average weekly price of $520/MWh.
The prospect of breaching the CPT still remains in the market, and we will continue to monitor how global gas price pressures flow through to electricity market outcomes.