The Administered Price Cap (APC) was triggered for the first state on 12 June at 6:55 am as a result of QLD breaching the Cumulative Price Threshold (CPT) of $1,359,100 for the rolling 7-day period. This caused the withdrawal of capacities by gas generators that could not recover fuel costs with the APC of $300/MWh.
The previous Chart of the Week shows that the bidding strategy of gas generators has changed significantly. These changes are expected to remain in the short to medium term, meaning that average prices in the NEM will likely remain above $300/MWh if gas is required. The question is whether NEM is out of the woods now, or is there still a chance for market suspension based on the current regulations? To answer this, we have analysed the recent market data to investigate the market conditions after the suspension.
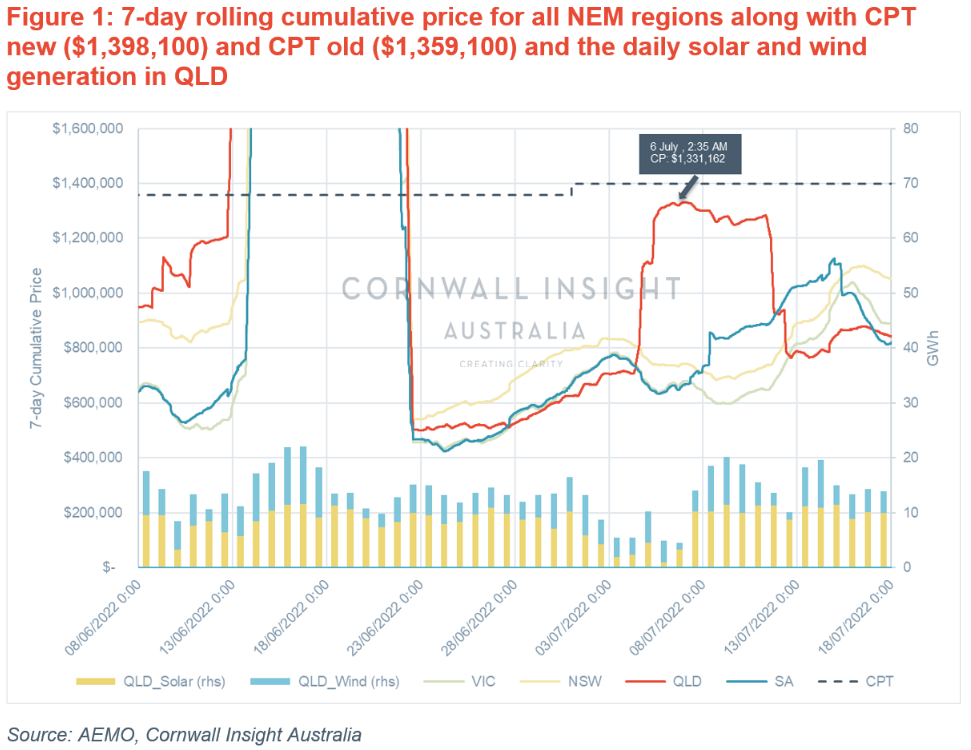
The following chart shows the 7-day rolling cumulative price for each region (lines) along with the daily solar and wind generations (bars) in QLD since 8 June 2022.
July 4-6: QLD was on the verge of triggering APC again
The cumulative price after the market suspension has been reduced, but interestingly, from 4 July, the cumulative price (CP) in QLD increased significantly and subsequentially reached a maximum of $1,331,162 on 6 July at 2:35 am, which is just under the threshold (noting the CPT rose slightly on 11 July to $1,398,100, with the market price cap also rising to $15,500/MWh). This means that only less than 30 minutes (6 dispatch intervals) of high price periods (>$10,000/MWh) would have resulted in the APC being triggered in QLD, potentially resulting in the same sequence of events that led to the market suspension in June.
The pre-dispatch sensitivity data shows that if the demand in QLD was 200 MW higher over the 5 July evening peak, the price could have been ~$5000/MWh instead of ~$450/MWh. This would have been enough to increase the CP to breach the CPT the next day at 2:30 am.
The driver for the spike in QLD price from 4 to 6 July was a sudden reduction in wind and solar generation in this region, which saw a drop from 10 GWh in previous days to less than 4 GWh. Furthermore, the average temperature decreased by ~3°C on 4 July across QLD, which increased the peak demand by 16% (8.6GW vs 7.4GW) compared to previous days. The combination of decreased renewable generation and the increased demand resulted in the higher bid gas generation coming online and causing the price to reach extremely high levels (>$10,000/MWh), particularly during the evening peak. This significantly ramped up the CP in QLD, such that it reached close to the CPT in the following 48 hours.
Luckily, there was a reduction in demand and an increase in renewable generation on 6 July, reducing the spot price and cumulative price in the following days. The historical pre-dispatch sensitivity data shows that in some instances during 4-6 July, an additional 500MW of lower cost generation, or less demand, could have reduced the price by a factor of 10 ($500/MWh instead of $5000/MWh), significantly lowering the price spikes and the CP. That 500MW could have been provided if there was enough installed storage capacity and/or demand response in QLD.
NEM outlook
Considering gas prices are likely to remain at high or even similar levels for the next 1-2 years, and the recent announcement by AEMO regarding the current shortage of gas reserve levels in VIC, the re-occurrence of price spikes and high CP is likely in the future. As the historical data shows, these price spikes could drive CP close to CPT in a short period of time, and the CP in NSW recently exceeded 1,000,000 (i.e. average price higher than $500/MWh). Therefore, it is worth monitoring how the change in the bidding strategy of gas generators will impact the market for the rest of the winter.
It is crucial that such events, which have high impacts, be taken into account when designing the market and the power system. For relatively short-duration events, such as the 2-3 days of reduced renewables in early July, short/medium duration storage (e.g., batteries) could mitigate the situation by load shifting the peak periods and providing additional security. However, for longer-lasting events, there is a need for long-duration storage technologies or more dispatchable generators.
With the 2022 ISP now released, there is a target for increasing penetration of renewables in the power system. As such, the question is now: Do we design the market and power system to be able to navigate a 1 in a 20-year event without intervention? Or is it preferable for the system operator to intervene and drive the market manually in extreme events?
For more information on how these dynamics may impact future NEM price dynamics, our Benchmark Power Curve has been recently released. If you would like further information, please contact us at enquiries@cornwall-insight.com.au.